
A study led by Professor Juliet Brodie and the Big Seaweed Search team examined the survey data collected between June 2016 and May 2020, assessing both the scientific value of the findings and the effectiveness of the project’s approach. The study also explored how the results could support future research and identified opportunities to strengthen and expand the next phase of citizen‑science development.
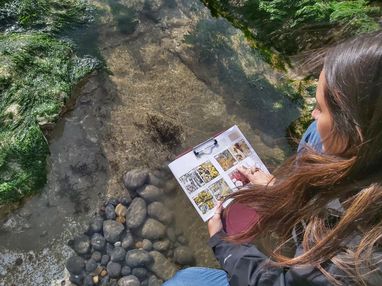
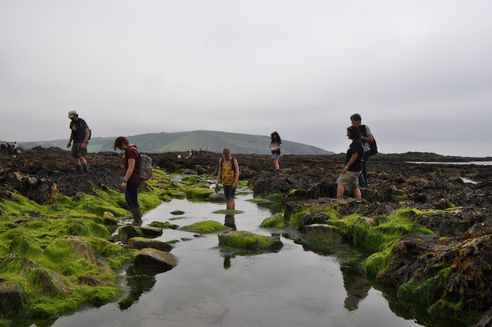
Student engaging in the Big Seaweed Search on Rottingdean Beach | Image credit: Kate Whitton
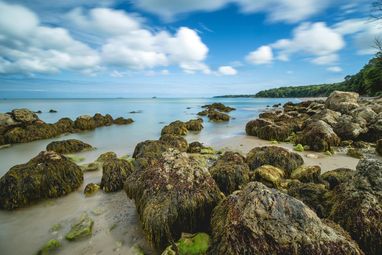
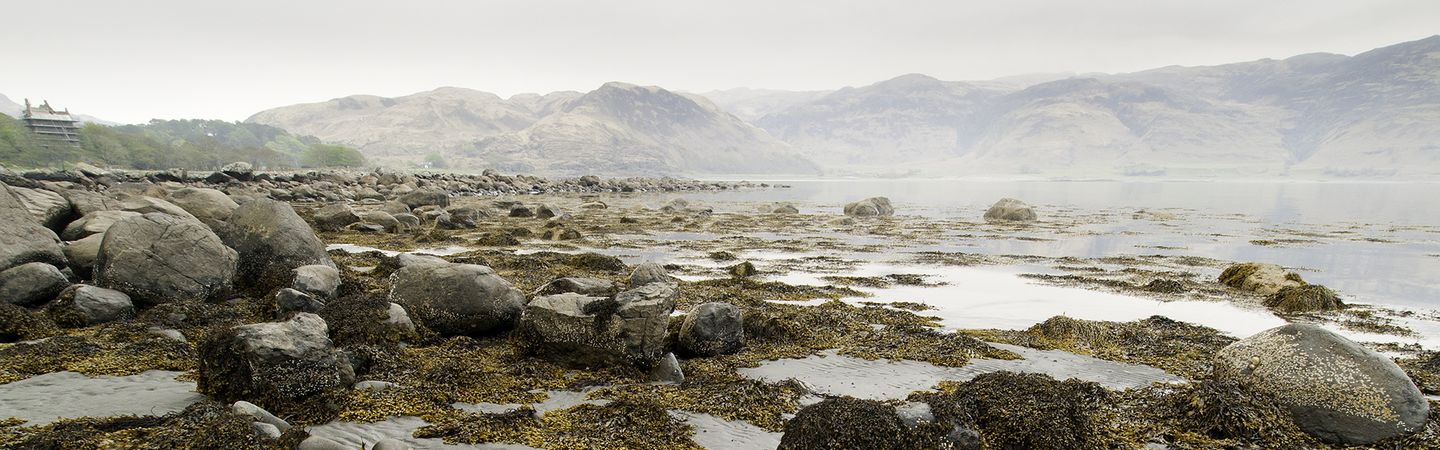
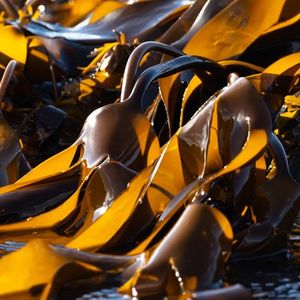
Seaweed made visible by a retreating tide at Seaview, Isle of Wight. | Image credit: Chris Hodges
Take part in the Big Seaweed Search
The Big Seaweed Search asks the public to record their observations of the state and abundance of various species. Whether you live by the sea or only visit every now and again, you can get involved in the Big Seaweed Search! It’s free, fun, and suitable for everyone – you don’t need to be a scientist to get involved.
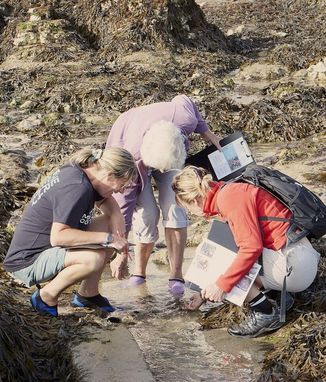
Volunteers participating in a Big Seaweed Search survey | Image credit: Billy Barraclough
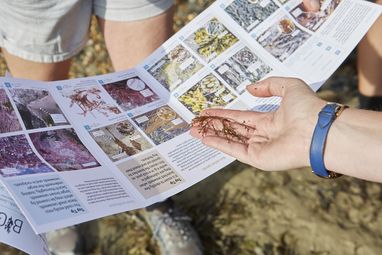
Volunteers checking a piece of seaweed against a seaweed identification guide | Image credit: Natural History Museum London
What did we discover?
After verification, 1,007 data records were accepted and have been used in a Red List assessment of British seaweeds. A Red List categorises species according to how endangered or at risk from extinction they are, proving how important this data is.
Whilst some of the data could not be verified, this still provides the research team with insight into the challenges associated with the methodology design or species identification. This information can allow future work to focus on developing areas of the project to improve data quality and make the project more accessible for participants.
What did the research find?
- Data from June 2016 to May 2020 were analysed (378 surveys, 1414 people, 1531 hours)
- The highest number of surveys were carried out in the Southwest and Celtic Seas regions (43.7%) [Map 1]
- The seaweed that was most often correctly identified was the common low shore species, Serrated wrack (Fucus serratus, 66%)
- The least correctly identified species was the invasive species, Wakame (Undaria pinnatifida, 5%) [Graph 1]
- Calcified crusts and coral weeds were most often recorded as patchy across survey plots
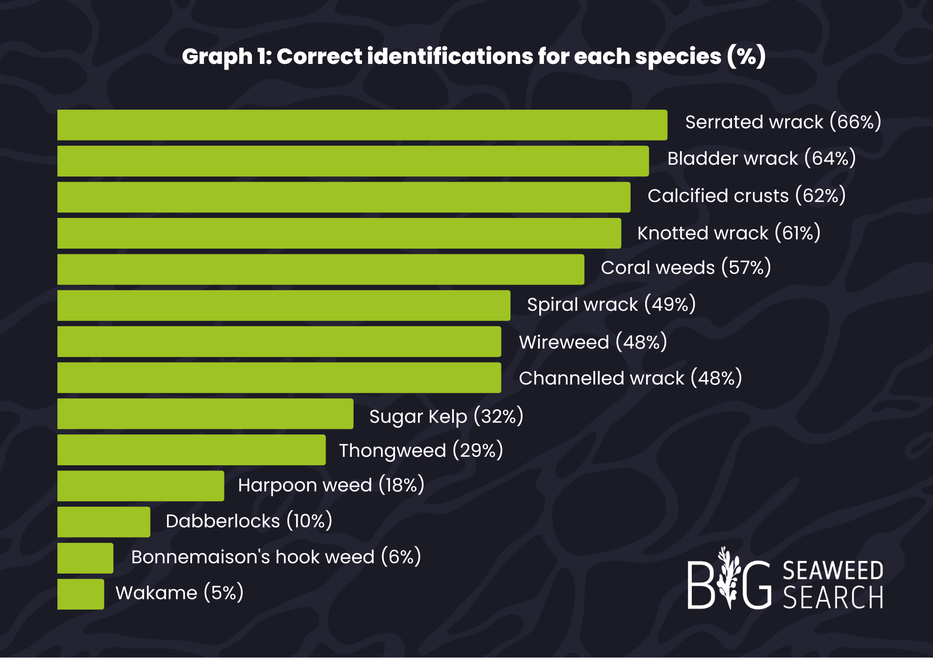
Seaweed identification graph
Image credit: Natural History Museum London
Learn more about seaweed
The potential of seaweed
Seaweed is something we’re all familiar with from trips to the beach, but its potential as a business opportunity for the aquaculture industry is now emerging.
What seaweed can teach us about climate change
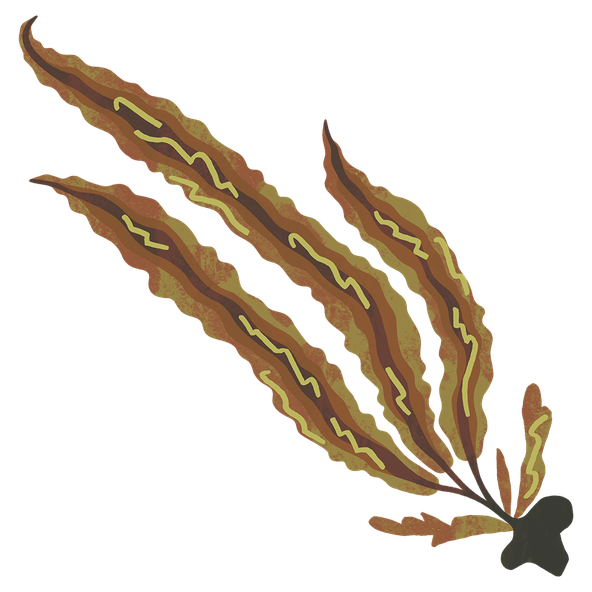
There are over 650 species of seaweed found around the UK and each plays a vital role in supporting the health of our ocean and planet and can tell us key information about the effects of climate change.
Meet the seaweed types
There are over 650 species of seaweed found around the UK and we’re on the lookout for 14 of them for The Natural History Museum and Marine Conservation Society's Big Seaweed Search.